Sezione Studi su Rennes-le-Château Analysis of alignments in R-Environment - Alignments on a line
In this analysis we'll use the first definition of alignment, so the function used will be: aligned <- function(x1,y1,x2,y2,x3,y3,e) Verify an alignment within a specific areaConsider this list of coordinates (given in Comma Separated Values format, courtesy of David Williams): coordinates.csv. Every line specifies - for each relevant item - an Id (from 1 to 100), the coordinates X and Y and a name. You can import it in R with the function: db<-read.csv(file="C:\\coordinates.csv",sep=";",header=T) You can ask R to print the loaded map on the screen: attach(db) 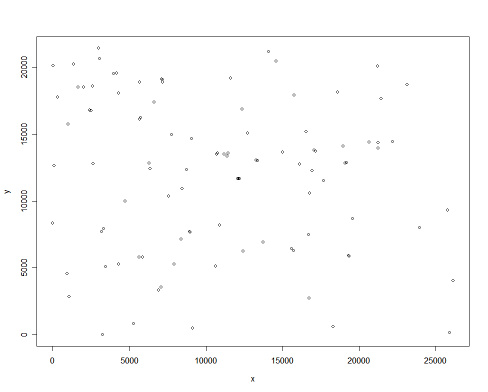 You can also add a label with the name of each point, but the result will be difficult to read! for(i in 1:length(x)) text(x[i],y[i],name[i],cex=0.5,pos=1) 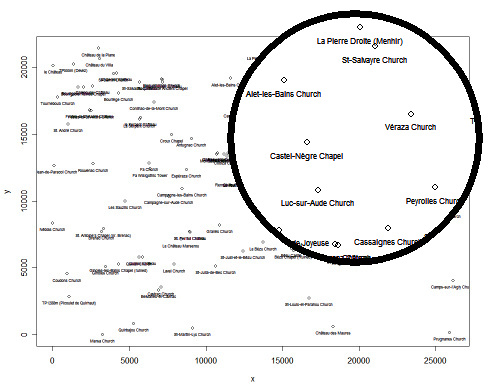 Now you can select the two key points you want to analyse, for example La Tour Magdala (Id=89) and Château de Blanchefort (Id=85). Let's verify if it is correct that Arques Church (Id=54) is aligned to the other two points, as stated by David Wood (quoted here). 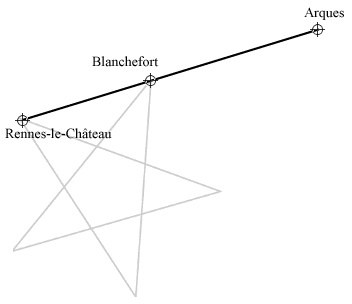 David Wood' alignment: is it correct? Let's verify it! You define the two points and the tolerance E: point1 <- 89 In order to verify the alignment we just have to ask: aligned(x[point1],y[point1],x[point2],y[point2],x[54],y[54],e) The answer is FALSE: they are not aligned with a tolerance 50 meters. They are aligned if we accept an error of 210 meters: by fixing e <- 210 the same request aligned(x[point1],y[point1],x[point2],y[point2],x[54],y[54],e) returns TRUE: they are aligned. We can verify it on a map in this way: plot(x,y,col="light gray")  In order to find the line passing through point 1 and point 2 we can use a linear regression. abline function draws the line through Tour Magdala and Château de Blanchefort: z <- lm(c(y[point1],y[point2]) ~ c(x[point1],x[point2])) 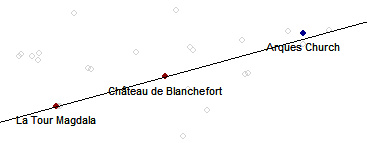 A problem raises...There's a problem with Definition #1: by using it, you can get paradoxical situations. They raise from the fact we are defining the corridor with the use of only two key-points - namely (x1,y1) and (x2,y2). See these points: 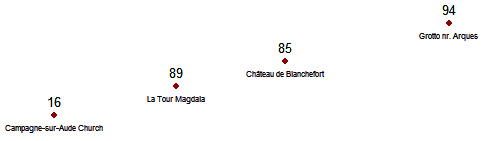 Let consider a tolerance of E=50. If we analyse the points 85, 89 and 94 the function aligned returns TRUE: they are aligned. aligned(x[85],y[85],x[89],y[89],x[94],y[94],50) If we analyse the points 94, 89 and 16 the function aligned returns TRUE again: they are aligned. aligned(x[94],y[94],x[89],y[89],x[16],y[16],50) This means that both 94 and 16 are aligned to 85 and 89. We expect a four-points alignment... but if you analyse the points 85, 89 and 16 you get FALSE! aligned(x[85],y[85],x[89],y[89],x[16],y[16],50) Does the set of point (16,85,89,94) create an alignment or not? The function aligned is not able to give a definite answer. The best way would be to define a aligned function not dealing with just a couple of points but a set of n-points. This function will be the core of the next chapter. © Mariano Tomatis Antoniono |